Facebook network analysis
This example demonstrates how to use the worker as a workflow system to load graph data, perform analyses and transformations of the data using NetworkX, and then visualize the result using d3.js.
- In this example we will:
- Obtain a set of Facebook data
- Find the most “popular” person in our data
- Find the subgraph of the most popular person’s neighborhood
- Visualize this neighborhood using d3
Obtain the dataset
The dataset is a small sample of Facebook links representing friendships, which can be obtained here [1].
The data we’ll be using is in a format commonly used when dealing with graphs, referred to as an adjacency list. The worker supports using adjacency lists with graphs out of the box.
Note
A full list of the supported types and formats is documented in Types and formats.
Here is a sample of what the data looks like:
86      127
303     325
356     367
373     404
475     484
Each integer represents an anonymized Facebook user. Users belonging to the same line in the adjacency list indicates a symmetric relationship in our undirected graph.
Build a workflow
Create a file named workflow.py, this is the file we’ll be using to create our workflow.
Find the most popular person
One way of measuring who the most “popular” person in our graph is, is by taking the node with the largest degree.
The script below finds the most popular person in the graph.
Note
This script assumes a variable G exists, that’s because we define it as an input in the Task we define in the next step.
from networkx import degree

degrees = degree(G)
most_popular_person = max(degrees, key=degrees.get)
Defining our task, we can embed this script:
most_popular_task = {
    'inputs': [
        {'name': 'G',
         'type': 'graph',
         'format': 'networkx'}
    ],
    'outputs': [
        {'name': 'most_popular_person',
         'type': 'string',
         'format': 'text'},
        {'name': 'G',
         'type': 'graph',
         'format': 'networkx'}
    ],
    'script':
    """
from networkx import degree

degrees = degree(G)
most_popular_person = max(degrees, key=degrees.get)
    """
}
Note
As we saw with our last script assuming G would in be scope, this task explicitly states that both most_popular_person and G will be in scope (as its outputs) when it’s done.
Find the neighborhood
Now that we have the most popular node in the graph, we can take the subgraph including only this person and all of their neighbors. These are sometimes referred to as Ego Networks.
from networkx import ego_graph

subgraph = ego_graph(G, most_popular_person)
Again, we can create a task using our new script, like so:
Note
Since these steps are going to be connected, our inputs are going to be the same as the last steps outputs.
find_neighborhood_task = {
    'inputs': [
        {'name': 'G',
         'type': 'graph',
         'format': 'networkx'},
        {'name': 'most_popular_person',
         'type': 'string',
         'format': 'text'}
    ],
    'outputs': [
        {'name': 'subgraph',
         'type': 'graph',
         'format': 'networkx'}
    ],
    'script':
    """
from networkx import ego_graph

subgraph = ego_graph(G, most_popular_person)
    """
 }
Put it together
Conceptually, this is what our workflow will look like:
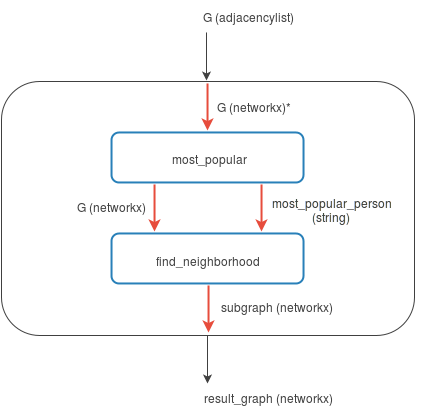
* The format changes because of Girder Worker’s auto-conversion functionality.
The entire rectangle is our workflow, and the blue rectangles are our tasks. Black arrows represent inputs and outputs and the red arrows represent connections which we’ll see shortly.
To make this happen, since we’ve written the tasks already, we just need to format this in a way the worker understands.
To start, let’s create our workflow from a high level, starting with just its inputs and outputs (the black arrows):
workflow = {
    'mode': 'workflow',
    'inputs': [
        {'name': 'G',
         'type': 'graph',
         'format': 'adjacencylist'}
    ],
    'outputs': [
        {'name': 'result_graph',
         'type': 'graph',
         'format': 'networkx'}
    ]
}
Now we need to add our tasks to the workflow, which is pretty straightforward since we’ve defined them in the previous steps.
workflow['steps'] = [{'name': 'most_popular',
                      'task': most_popular_task},
                     {'name': 'find_neighborhood',
                      'task': find_neighborhood_task}]
Finally, we need to add the red arrows within the workflow, telling the worker how the inputs and outputs are going to flow from each task. These are called connections in Girder Worker parlance.
workflow['connections'] = [
    {'name': 'G',
     'input_step': 'most_popular',
     'input': 'G'},
    {'output_step': 'most_popular',
     'output': 'G',
     'input_step': 'find_neighborhood',
     'input': 'G'},
    {'output_step': 'most_popular',
     'output': 'most_popular_person',
     'input_step': 'find_neighborhood',
     'input': 'most_popular_person'},
    {'name': 'result_graph',
     'output': 'subgraph',
     'output_step': 'find_neighborhood'}
]
We now have a complete workflow! Let’s run this, and write the final data to a file.
with open('docs/static/facebook-sample-data.txt') as infile:
    output = girder_worker.tasks.run(workflow,
                               inputs={'G': {'format': 'adjacencylist',
                                             'data': infile.read()}},
                               outputs={'result_graph': {'format': 'networkx.json'}})

with open('data.json', 'wb') as outfile:
    outfile.write(output['result_graph']['data'])
Running workflow.py will produce the JSON in a file called data.json, which we’ll pass to d3.js in the next step.
For completeness, here is the complete workflow specification as pure JSON:
{
  "mode": "workflow",
  "inputs": [
    {
      "type": "graph",
      "name": "G",
      "format": "adjacencylist"
    }
  ],
  "outputs": [
    {
      "type": "graph",
      "name": "result_graph",
      "format": "networkx"
    }
  ],
  "connections": [
    {
      "input": "G",
      "input_step": "most_popular",
      "name": "G"
    },
    {
      "output": "G",
      "input_step": "find_neighborhood",
      "input": "G",
      "output_step": "most_popular"
    },
    {
      "output": "most_popular_person",
      "input_step": "find_neighborhood",
      "input": "most_popular_person",
      "output_step": "most_popular"
    },
    {
      "output": "subgraph",
      "name": "result_graph",
      "output_step": "find_neighborhood"
    }
  ],
  "steps": [
    {
      "name": "most_popular",
      "task": {
        "inputs": [
          {
            "type": "graph",
            "name": "G",
            "format": "networkx"
          }
        ],
        "script": "\nfrom networkx import degree\n\ndegrees = degree(G)\nmost_popular_person = max(degrees, key=degrees.get)\n",
        "outputs": [
          {
            "type": "string",
            "name": "most_popular_person",
            "format": "text"
          },
          {
            "type": "graph",
            "name": "G",
            "format": "networkx"
          }
        ]
      }
    },
    {
      "name": "find_neighborhood",
      "task": {
        "inputs": [
          {
            "type": "graph",
            "name": "G",
            "format": "networkx"
          },
          {
            "type": "string",
            "name": "most_popular_person",
            "format": "text"
          }
        ],
        "script": "\nfrom networkx import ego_graph\n\nsubgraph = ego_graph(G, most_popular_person)\n",
        "outputs": [
          {
            "type": "graph",
            "name": "subgraph",
            "format": "networkx"
          }
        ]
      }
    }
  ]
}
This file can be loaded with Python’s json package and directly sent to girder_worker.tasks.run():
import json

with open('docs/static/facebook-example-spec.json') as spec:
    workflow = json.load(spec)

with open('docs/static/facebook-sample-data.txt') as infile:
    output = girder_worker.tasks.run(workflow,
                               inputs={'G': {'format': 'adjacencylist',
                                             'data': infile.read()}},
                               outputs={'result_graph': {'format': 'networkx.json'}})

with open('data.json', 'wb') as outfile:
    outfile.write(output['result_graph']['data'])
Note
More information on Girder Worker tasks and workflows can be found in API documentation.
Visualize the results
Using JavaScript similar to this d3.js example we’re going to add the following to our index.html file:
<!DOCTYPE html>
<meta charset="utf-8">
<style>
 .node {
     stroke: #fff;
     stroke-width: 1.5px;
 }

 .link {
     stroke: #999;
     stroke-opacity: .6;
 }
</style>
<body>
    <script src="https://cdnjs.cloudflare.com/ajax/libs/d3/3.5.5/d3.min.js"></script>
    <script>
    var width = 700,
    height = 400;

    var force = d3.layout.force()
            .charge(-120)
            .linkDistance(30)
            .size([width, height]);

    var svg = d3.select("#popularity-graph").append("svg")
            .attr("width", width)
            .attr("height", height);

    d3.json("/data.json", function(error, graph) {
        if (error) throw error;

        force
            .nodes(graph.nodes)
            .links(graph.links)
            .start();

        var link = svg.selectAll(".link")
                .data(graph.links)
                .enter().append("line")
                .attr("class", "link")
                .style("stroke-width", function(d) { return 1; });

        var node = svg.selectAll(".node")
                .data(graph.nodes)
                .enter().append("circle")
                .attr("class", "node")
                .attr("r", 5)
                .style("fill", "#1f77b4")
                .call(force.drag);

        node.append("title")
            .text(function(d) { return d.id; });

        force.on("tick", function() {
            link.attr("x1", function(d) { return d.source.x; })
                .attr("y1", function(d) { return d.source.y; })
                .attr("x2", function(d) { return d.target.x; })
                .attr("y2", function(d) { return d.target.y; });

            node.attr("cx", function(d) { return d.x; })
                .attr("cy", function(d) { return d.y; });
        });
    });
Which should leave us with a visualization similar to the following:
This is of course a more verbose than necessary workflow for the purposes of demonstration. This could have easily been done with one task, however by following this you should have learned how to do the following with the Girder Worker:
- Create tasks which consume and produce multiple inputs and outputs
- Run tasks as part of a multi-step workflow
- Use the worker’s converter system to serialize it in a format JavaScript can read
- Visualize the data using d3.js
| [1] | For attribution refer here. |